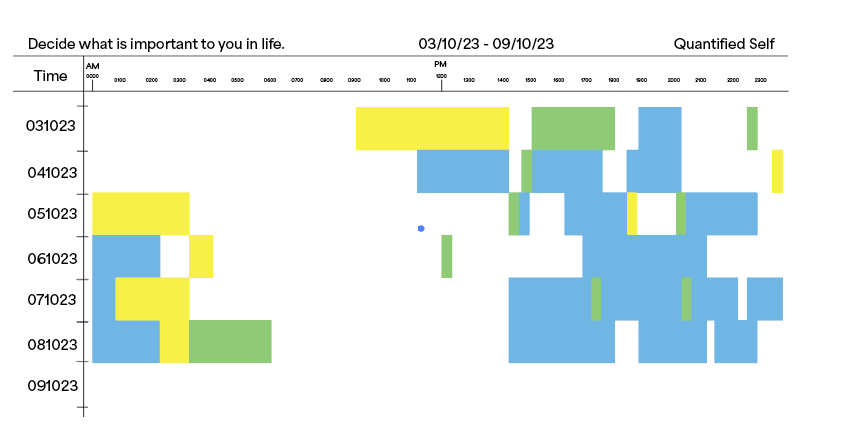
- How we then rank our criteria and "our battery" usage
- 1. Work (High battery Usage)
- 2. Social (Medium battery Usage)
- 3. Me/Alone (Low battery Usage)
In our metaphorical framework, we classify our mental capacity as analogous to battery usage, drawing parallels between the energy consumption patterns of electronic devices and the cognitive demands of our daily activities. In this comparison, our mental battery is a finite resource that we allocate across various aspects of our lives, each demanding a different level of cognitive energy.

We have developed a timetable that captures the activities that we are regularly involved in throughout the day. The timetable includes comprehensive descriptions of these daily activities, offering additional context and insights into each aspect of our collective routine. Given the intricate timetable design, We have identified a pattern that we believe could serve as an experimental foundation for our project. The skeleton below outlines how we can adapt this timetable to document our activities during the term break, serving as a guide for the typography presentation. Moving forward, We will be strategising the content flow within the artefact to ensure a coherent and engaging presentation of the project.